Document Type : Original Research
Authors
1 Chronic Diseases Research Center, Endocrinology and Metabolism Population Sciences Institute, Tehran University of Medical Sciences, Tehran, Iran
2 Endocrinology and Metabolism Research Center, Endocrinology and Metabolism Clinical Sciences Institute, Tehran University of Medical Sciences, Tehran, Iran
3 Department of Surgery, Tehran University of Medical Sciences, Shariati Hospital, Tehran, Iran
4 Department of Pathology, Shariati Hospital, Tehran University of Medical Sciences, Tehran, Iran
Highlights
✅RASSF1 promoter methylation can be a PTC genetic marker. RASSF1 promoter methylation is under the impact of the methyltransferase genes (DNMT1 and MGMT), protein expression, and promoter methylation.
Keywords
Subjects
Endocrine tumors include thyroid, adrenal, pancreas, parathyroid, and pituitary glands (1). Thyroid cancers are classified into four main types: papillary thyroid cancer (PTC), follicular thyroid cancer (FTC), medullary thyroid cancer (MTC), and anaplastic thyroid cancer (ATC) (2, 3). PTC is the most common form of well-differentiated thyroid cancer (1.0%–1.5% new cases per year) with growing incidence over the last three decades all over the world (4-8). PTC is typically an asymptomatic disease and it is identified through the mass in the anterior neck of patients usually when they are in their thirties and forties (9-11). PTC cells can occasionally migrate to the adjacent lymph nodes and rarely to distant organs; thus, adjacent and distant metastasis to the lungs and bones can be seen in metastatic form of PTC (12, 13). Nowadays, fine needle aspiration (FNA) is a common test for evaluating thyroid nodules, but it can be reported as the uncertain in some rare cases (14, 15). Accordingly, finding some genetic biomarkers for classifying malignant and benign cases before metastasis could be an essential measurement for both thyroid cancer patients and clinicians (16-19). In thyroid malignancies, the most important genetic and epigenetic alterations start their functions through activating metabolic pathways like mitogen-associated protein kinase (MAPK)/extracellular signal-regulated kinase (ERK) (20-22). Genetic and epigenetic changes of the genome can result in protein expression alterations like EGFRvIII, CD56, P63, CK19, estrogen receptors (ERs), and Survivin that are usually checked by immune-histochemical (IHC) studies (23-26). Histopathology is the microscopic study of targeted surgically removed tissue and for accurate diagnosis of cancer and other diseases, histopathological examination of samples is required (27-31). IHC is a useful method for determining the exact origin of tumor cells and sometimes discrimination between non-neoplastic disorders (32-35). Common histopathology and clinical features can be used for PTC and other papillary cancer types; moreover, some additional genetic and epigenetic biomarkers can support them (36). In fact, genetic and epigenetic biomarkers can fill the gap of exact diagnosis through imaging (ultrasound technology) and cytology, as the usual detection methods (37-39). Some genetic markers are mutations, polymorphisms, amplifications, and translocations, and epigenetic markers addition to microRNAs (34, 40). Contrary to genetic modifications that alter the sequence of genes constantly, the methylation is resulting in the alteration of gene expression patterns without changing the DNA sequence in a reversible manner (41, 42). Epigenetic silencing through aberrant DNA methylation of tumor suppressor genes can bring devastating consequences and cause human cancer formation (42, 43). Hyper-methylation of several tumor suppressor genes (TSHR, ECAD, SLC5A8, DAPK, TIMP3, and RARB2) are linked to the aggressive features of PTC (27, 44-47). Methylation status is mostly reported as the Methylated (M) or Unmethylated (U) so the methylation quantity is not available. Unfortunately, the common use of non-quantitative methylation detection method cannot represent the exact methylation in promoter region of reported hyper-methylated loci. Moreover, non-quantitative methylation detection method is prone to the inclusion of false positive results (48). Furthermore, the failure to quantify methylation incorrectly assumes homogeneity of stages and the significance of all detected methylation (49). Thanks to the new approach of promoter methylation quantification based on high resolution melting (HRM), now it is possible to determine the quantity of methylated cytosine in CpG dinucleotide (CpG islands) (50-53). Assessment of DNA methylation quantity can be a critical factor for the identification, development, and application of methylation-based biomarkers in cancer. This study aims to identify DNA methylation quantity of four tumor suppressor genes using the methylation-sensitive high resolution melting (MS-HRM) assay technique.
Materials and Methods
Tissue Samples
This study was approved by the Research Ethics Committee of the Endocrinology and Metabolism Research Institute, Tehran University of Medical Sciences (IR.TUMS.EMRI.REC.1395.00114). Totally, 95 human thyroid tissues were obtained from fresh frozen surgically resected thyroid tissues (≥15 mm). In order to reduce contamination, all resected tissues were snap frozen in liquid nitrogen and independently analyzed. The demographic information of the patients and adenoma characteristics analyzed in this study are presented in Table 1. An informed consent was taken from all participants for the tissue collection in compliance with our institutional guidelines.
DNA extraction
Fresh frozen tissue specimens were cut on dry ice from fresh frozen surgical material stored at −180°C by using a scalpel. Then, DNA was extracted using the DNeasy Blood & Tissue Kit (Qiagen, Cat No:69504) according to the manufacturer’s protocol. DNA purity and quantity was determined using a Thermo Scientific™ NanoDrop™ spectrophotometers 2000c spectrophotometer (Thermo Fisher Scientific Inc). All the extracted thyroid tissue DNAs were stored at - 80°C.
Table 1. Demographics of PTC patients (cases) and goiter patients (control)
| Variables | Case (n= 55) | Controls (n=40) | P-value |
| Age (years) | 42.28 (±14.32) | 43.16 (±9..31) | 0.624 |
| Gender | |||
| Female | 38 (70.90%) | 31 (77.50%) | |
| Male | 17 (30.90%) | 9 (22.5%) | 0.306 |
| Weight | 70.51 (±12.19) | 73.60 (±10.91) | 0.204 |
| Height | 164.96 (±7.96) | 167.32 (±9.55) | 0.370 |
| BMI | 28.85 (±4.09) | 31.26 (±0.79) | 0.093 |
| SBP | 121.91 (±16.01) | 118.77 (±11.10) | 0.963 |
| DBP | 76.58 (±11.79) | 70.05 (±9.79) | 0.491 |
BMI: Body Mass Index, SBP: Systolic Blood Pressure, DBP: Diastolic Blood Pressure.
There was no statistically significant difference between the two groups of PTC patients (cases) and goiter patients (control) in basic characteristics.
Bisulfite Modification and Quantitative Methylation Detection
Bisulfite conversion altered the DNA sequence depending on the methylation status of individual unmethylated Cytosines (C) conversion to uracil in genomic DNA; these changes can be detected via HRM analysis (54). Then, 150-200 ng of DNA from each sample was treated with sodium bisulfite conversion kit by the “EpiTect® Bisulfite Kit” (Qiagen, Cat No: 59104) according to the manufacturer's protocol. The melting profiles of bisulfite-modified PCR products can be used to indicate methylation status, when samples are unknown. These processes were run by bisulfiting pre-treatment and unbiased PCR amplification of both methylated and unmethylated templates of the targeted region. Therefore, for the MS-HRM of SLC5A8, RASSF1, MGMT and DNMT1 genes promoter region amplification we used gene specific primers. The MS-HRM analyses were run based on three main stages: holding stage, cycling stage, and melt curve stage.
Statistical Analysis
Samples were considered as hyper-methylated and hypo-methylated when the measured methylation point was more than the 12% mean methylation level and less than the 12% mean methylation level, respectively. Correlations between the methylation levels and demographic and histopathological characteristics in the two groups were analyzed using DNA methylation. All analyses were done by SPSS®, version 16.0, license (SPSS Inc., Chicago, IL. USA), and P-value
Results
We examined the 12-loci promoter methylation of fresh frozen tissue (55 PTC cases vs. 40 goiter controls) for four tumor suppressor genes. The age of all samples ranged from 18 to 86 years. For each run of MS-HRM, five wells were allocated to control samples (0%, 50%, and 100%). Numerous replicates of the diluted samples were amplified by PCR. Then melting profile of each reaction was used to define its methylation status. The hyper/hypo-methylations in each sample could be freely estimated by comparing them to the control peaks (Figure 1).

Fig. 1. The graph of targeted promoter region of RASSF1 in comparison with 50% controls. Part A indicates hypo-methylation (yellow line) and Part B indicates hyper-methylation (red line).
Quantification of each locus of the four targeted genes is presented in Table 3. In addition, each locus methylation quantification and the overall methylation status of each gene was earned through two regions of RASSF1, three regions of SLC5A8, three regions of DNMT1, and four regions of MGMT (Table 2).
The cut-off value of methylation was defined according to several references (U if it was ≤12% and M if it was ≥12%) (55-57).
All candidate tumor suppressor gene promoter hyper-methylation was significantly different in two groups of PTC cases and controls except DNMT1. Thus, for sensitivity analysis adjusting for demographic variables and risk factors we have done several logistic regression models for potentially confounding variables Table 3). Two DNA methyltransferases of MGMT and DNMT1 also adjusted in model III and IV in order to check their impact on the methylation pattern.
In model III (MGMT adjusted model) the odds ratio of RASSF1 and SLC5A8 promoter hyper-methylation and risk of PTC increased in comparison with model I (crude model). However, in model IV (DNMT1 adjusted model), the RASSF1 and SLC5A8 promoter hyper-methylation and risk of PTC decreased a little in comparison with model I (crude model).
Table 2. The difference of methylation quantification of 12-promoter loci of four targeted tumor suppressor genes
| Promoter Region | Methylation* | PTC Cases Number (percent) |
Goiter Cases Number (percent) |
P-value |
| SLC5A8 |
U | 16(29.09%) | 34(85.0%) | 0.002 |
| M | 39 (70.9%) | 8 (20.0%) | ||
| RASSF1 |
U | 11(20.8%) | 38 (95.0%) | <0.001** |
| M | 44(80.0%) | 2 (5.0%) | ||
| MGMT |
U | 7 (14.0%) | 29 (72.5%) | 0.001 |
| M | 49 (12.72%) | 11 (27.5%) | ||
| DNMT1 | U | 25 (45.45%) | 30 (75%) | 0.018 |
| M | 30 (54.54%) | 10 (25%) |
*Methylation is categorized from 1 to 5 according to methylation quantification results.
1=0 percent methylated; 2=25 percent methylated; 3=50 percent methylated; 4=75 percent methylated; and 5=100 percent methylated.
The mean methylation of several loci of one gene was calculated and categorized as U if it was ≤12% and M if it was ≥12%** The most significant P-value was reported for RASSF1 gene.
Table 3. The association of methylation in four tumor suppressor genes SLC5A8, RASSF1, MGMT, and DNMT1
| Model | SLC5A8 | RASSF1 |
| Model I | 8.24 (3.34 - 20.32) | 18.37 (6.65 - 50.76) |
| Model II | 8.72 (3.36 - 22.67) | 16.29 (5.72 - 46.34) |
| Model III | 9.94 (2.87 - 34.45) | 19.02 (4.97 - 75.52) |
| Model IV | 8.85 (3.23 - 24.24) | 16.52 (5.62 - 48.6) |
Model I is crude model, Model II is age and sex adjusted model, Model III is age, sex, and MGMT methylation status adjusted, and Model IV is age, sex, DNMT1 methylation status adjusted.
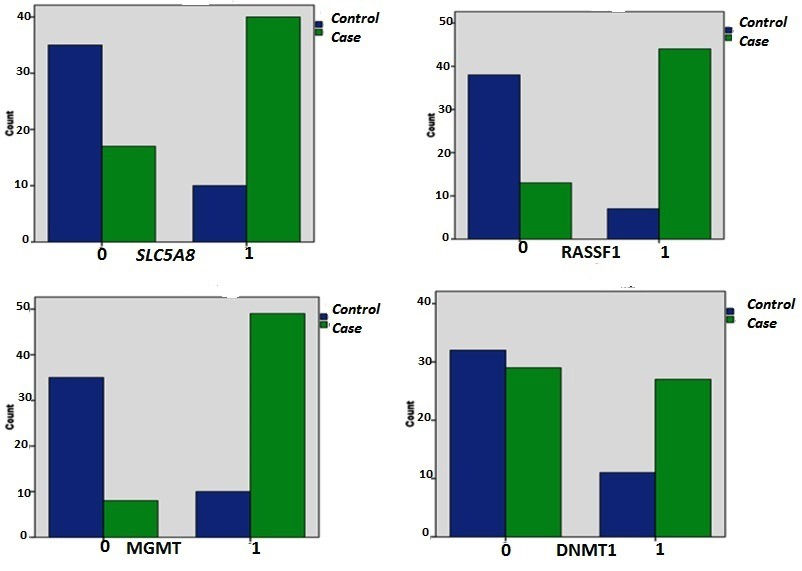
Fig. 2. Promoter quantification differences of SLC5A8, RASSF1, MGMT and DNMT1 methylation in PTC cases and controls.
Discussion
The role of aberrant methylation of tumor suppressor genes more than functionally chief regulatory genes is a frequent event in certain human tumors and developmental abnormalities (58, 59). In eukaryotic cells there are special DNA methyltransferase enzymes which put or remove the methyl group on/off the cytosine base of CpG islands and regulate the conformation change between methylated and unmethylated forms (60, 61). DNMT1 is the most abundant DNA methyltransferase in mammalian cells and extra active on hemi-methylated DNA as compared with unmethylated substrate in vitro, but it is still more active at de novo methylation than other DNMTs (62-64). Several studies have shown that changing the DNA methylation patterns in the regulatory promoter regions of DNMT1 play an important role in the development of genetic disorders (65-68). DNMT1 promoter methylation was present in primary and recurrent gliomas (69). The DNMT1 expression can be regulated through its promoter methylation patterns in the core promoter region of DNMT1 in several human neoplastic tissues (70, 71). The different methylation status of DNMT1 (b) in our study can be attributed to this region as the core promoter region that can have a role in PTC. It can also be supported by the idea that epigenetic regulation of the methylation status of DNMT genes can regulate epigenetic profile of extra embryonic tissue in humans (72). It has been shown that some medication targeting DNMT1 can inhibit migration and invasion of thyroid cancer cells through down-regulating DNMT1 (73). In contrast, some results indicated that DNMT1 was neither overexpressed in PTC nor correlated with tumor stage and capsular/vascular or lymphatic invasion (74). Yi Cai et al. (2017) pointed out to the critical threshold levels of DNMT1 as an important factor of DNA methylation maintenance across the genome in human cancer cells (75). However, our results indicated that DNMT1 methylation in PTC patients, in comparison with goiter patients (controls), was less than SLC5A8, RASSF1, and MGMT.
O6-methylguanine DNA methyltransferase is a protein in humans encoded by the MGMT gene, and it is a maintenance methyltransferases that is crucial for genome stability (76, 77). In a colorectal cancer study it was suggested that MGMT expression reduced after hyper-methylation of the MGMT promoter region (78). MGMT is suppressed epigenetically and in different ways such as promoter region hyper-methylation and over-expression of a number of microRNAs (79-84). Inactivation of the MGMT through promoter hyper-methylation is a common event in primary human malignancies (71, 85). Esteller et al. described a straight line of MGMT aberrant methylation and k-Ras and p53 genes mutation in colorectal cancer (85, 86). The promoter methylation of two candidate regions of MGMT were associated with PTC. In a MGMT adjusted model the odds ratio of RASSF1 and SLC5A8 promoter hyper-methylation and risk of PTC increased in comparison with model I (crude model). Supporting information is reported by Herfarth et al. that linked the specific CpG methylation pattern of the MGMT promoter region with decrease of MGMT expression in primary colorectal cancers (87). Moreover MGMT methylation is reported in a group of discriminating methylation markers that differentiate thyroid cancer from benign nodules (88). Moreover, MGMT methylation was reported in MLH1 and MGMT expression and their consequence in genomic instability in patients with thyroid carcinoma (89).
SLC5A8 can predominantly be found in the small intestine, colon, thyroid gland, kidney, and salivary glands and to a lesser extent in the retina and brain (90-93). It was shown that SLC5A8 expression, as a sodium/iodide symporter (NIS) member, decreased in several malignancies, including thyroid cancers and its methylation is shown as the discriminative marker between malignant and benign thyroid tumors (88, 94). We recently conducted a meta-analysis the results of which indicated that SLC5A8 was the most significant methylated gene in thyroid cancers (95). CpG island methylation of tumor-related promoters including RASSF1, MGMT, and SLC5A8 occurs preferentially in undifferentiated thyroid carcinoma (96). In contrary, the overexpression of SLC5A8 together with IRX1 and EBF3 may be involved in the transforming growth factor beta signaling pathway, which is often disrupted in head and neck squamous cell carcinoma. Silencing of the SLC5A8 through its promoter methylation was associated with BRAF mutations in classical PTC (97). Hyper-methylation of SLC5A8 promoters reported preferentially in undifferentiated carcinoma (98).
The Ras association domain-containing protein 1 (RASSF1), which is encoded by RAS gene altered expression, is associated with the pathogenesis of a variety of cancers (99-103). The most frequent molecular mechanism for RASSF1 suppression in different malignancies is the ishypermethylation of its CpG-island promoter region (104-108). Frequent epigenetic silencing of the RASSF1A in thyroid carcinoma has been highlithed (109) alone or with NORE1A methylation and BRAFV600E mutations (110). RASSF1 methylation can be used as the therapeutic determinant in thyroid malignancies (111). In a meta-analysis it was reported as the most significant hyper-methylated region within thyroid carcinomas (112). The survival rate and prognosis in head and neck squamous cell carcinoma (HNSCC) patients was dependent on 11 tumor-related genes, including RASSF1 and MGMT. The adjusted model of age, sex, and DNMT1 methylation status did not change the link of RASSF1 methylation and PTC cancer risk. Meanwhile, Bai et al. reported that DNMT1 inhibits proliferation, metastasis, and invasion in esophageal squamous cell carcinoma by suppressing methylation of RASSF1 and DAPK (30, 113). Methylation of RASSF1 gene promoter can be regulated by p53 and DAXX (114, 115).
According to the results, RASSF1 and SLC5A8 promoter methylations can be a PTC diagnostic biomarker which are completely dependent on DNMT1 or MGMT promoter methylation status.
Acknowledgements
The National Institute for Medical Research Development (NIMAD, Grant number: 965417) and Iran National Science Foundation (INSF, Grant number: 83107) funded this article.
Conflicts of Interest
The authors declared no conflict of interest regarding the publication of this article.

| Article View | 1,161 |
| PDF Download | 641 |